

Originally published June 2025 · Last updated October 12, 2026
Table of Contents
In June 2024 we installed a 3.39 kW PM Surya Ghar rooftop solar plant at our home in Lucknow. After 28 months of using it, these are the questions people ask me most:
- How many units does a 3kW solar plant really produce per day?
- What did it cost after the central and UP subsidy?
- What is the real payback period?
- Do solar panels lose output over time?
- Can I run a 1.5 ton AC on a 3kW on-grid solar system?
So here is my own data. Every number comes from my inverter app and my records, and no brand, installer or reviewer sponsored or checked this article.
Quick summary
- System: 3.39 kWp on-grid plant, 6 × 565W Adani TOPCon bifacial panels with a 3 kW string inverter, installed 17 June 2024.
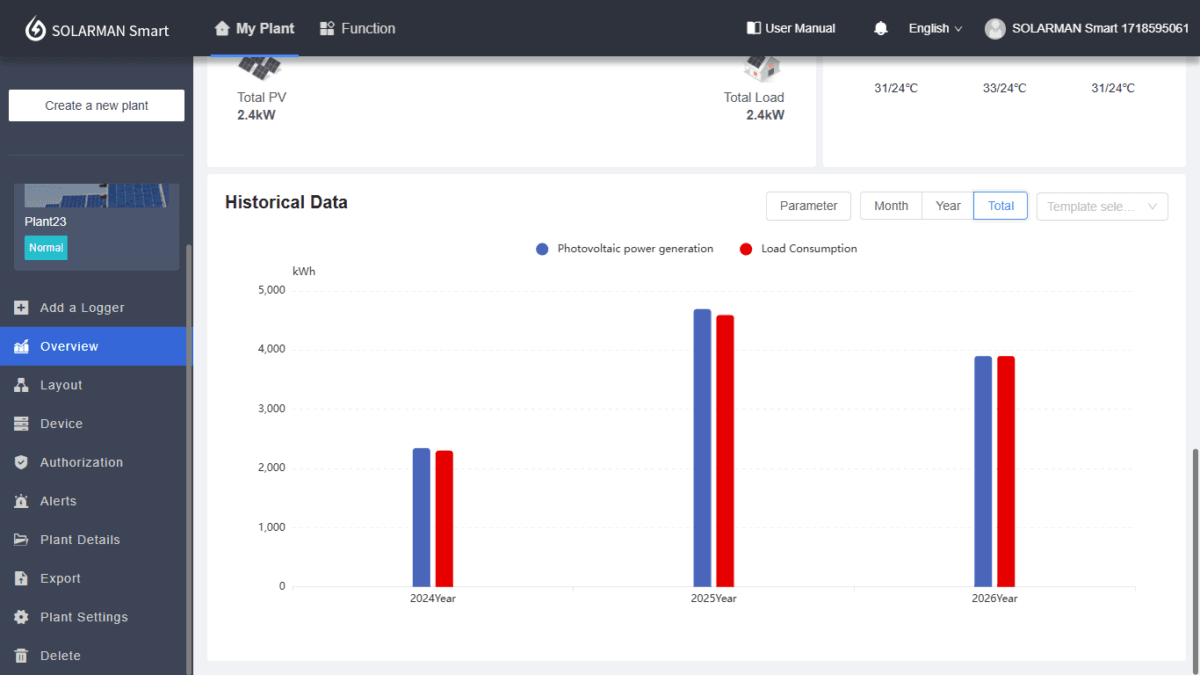
- Generated: 10,765 kWh from June 2024 to September 2026 (28 months). Full-year 2025: 4,693.8 kWh, about 1,385 kWh per kWp.
- Typical output per day: 15–18 units in March–May, 10–12 in the monsoon, 8–10 in winter.
- Net cost: ₹95,400 after the ₹78,000 central subsidy and the ₹30,000 Uttar Pradesh subsidy.
- Payback: about 3.1 years at ₹6.5 per unit, or about 4.1 years without the UP top-up.
- Degradation: nothing I can separate from weather yet. Jan–Sep 2026 is +0.4% against the same months of 2025.
Check My Plant’s Generation for Any Month
Pick a year and a month to see what my 3.39 kW plant produced, and how that month compares with the same month a year earlier.
My verdict in short
For our household, the plant has done what we hoped: steady generation across two full years, no downtime, and a payback that looks like about three to four years. That result depends on three things I explain below: Uttar Pradesh adds a state subsidy, I price each unit at ₹6.5, and my installation cost is from June 2024. Check all three against your own situation before copying my numbers.
Why I installed solar
Electricity bills kept rising, and the PM Surya Ghar scheme, launched in February 2024, made the investment far more affordable. The subsidy, a lower carbon footprint and less dependence on rising tariffs made the decision easy. We hired a local installer and went with a 3.39 kW system.
Also Read: How Rooftop Solar Works in India: Net Metering & Electricity Bill Explained
My plant details
| Item | Detail |
|---|---|
| Panels | 6 × Adani 565W, TOPCon bifacial, monocrystalline, DCR (domestic content) modules |
| Capacity | 3.39 kWp |
| Inverter | EEVO string inverter, rated 3 kW (can run about 15% above rating) |
| Installer | Ram Solar Waves, Lucknow |
| Installed | 17 June 2024, in 5 days |
| Roof area | About 300 sq ft including mounting and walking clearance |
| Metering | Net metering, included in the installer’s package |
| Installation rating | 5/5 (my own rating) |
If you are weighing inverter types, I compared them here: Micro Inverter vs String Inverter: ROI Comparison for Indian Homes. For how net metering works on your bill, see How Rooftop Solar Works in India.
Installation and subsidy experience
The installation took five days. Net metering and approvals were handled as part of the package. [Add: date the net meter went live.] The subsidy was credited after net-meter installation and DISCOM inspection. [Add: date the central subsidy and the UP subsidy were credited, and how many days that took from installation.]
The one real friction was the national portal, where the subsidy process was delayed for a while. If you apply, make sure your bank details match your electricity bill exactly, which avoids most of the back-and-forth.
How Much Did My 3kW Solar Plant Cost After Subsidy?
| Item | Amount |
|---|---|
| Total system cost (June 2024) | ₹2,03,400 |
| Central subsidy (PM Surya Ghar) | ₹78,000 |
| Uttar Pradesh state subsidy | ₹30,000 |
| Total subsidy | ₹1,08,000 |
| Net cost | ₹95,400 |
The UP state subsidy is ₹15,000 per kW up to a maximum of ₹30,000 per residential consumer, so a 3 kW or larger system gets the full amount. Rules change, so confirm the current figure with UPNEDA before you apply. The central subsidy is only available with DCR (domestic content requirement) panels, which is why mine are DCR modules.
To check whether a module is DCR-compliant, use the Solar DCR Verification Portal, run by the National Institute of Solar Energy. Since 1 December 2024, MNRE does not accept modules whose DCR status can’t be verified there (MNRE memo, 11 November 2024). MNRE also publishes the approved list of module models and manufacturers.
I checked my own panels. The portal’s Verify DCR Certificate / Module page lets you search by certificate number or by panel number. I entered one of my panel numbers and answered the short security question. The result: panel AS2401182C5521 is DCR (domestic content requirement). The portal lists the manufacturer as Mundra Solar PV Limited and the customer as Saurya Dimensions, the Adani panel distributor for Uttar Pradesh, and it masks most of the DCR certificate number (6386-XXXX-XXXX-3761).
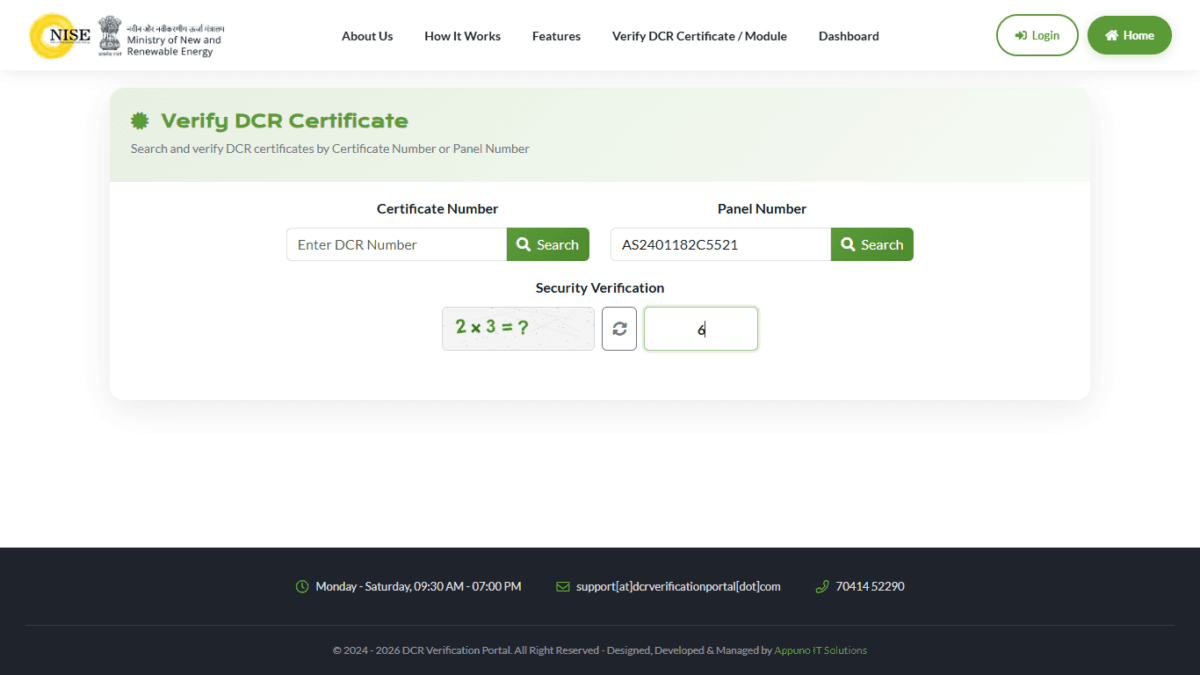

Screenshot of DCR tracking on Solar DCR Verification Portal – Panel number present under panel
This is my June 2024 price. To my knowledge, GST on most solar equipment was cut to 5% in September 2025, so ask installers for a current itemised quote rather than relying on my cost.
Month-by-month generation
The figures below come from my inverter app. The value column is units × ₹6.5, the tariff configured in the app, so it is a notional value and not my actual bill saving.
| Month | Production (kWh) | Value at ₹6.5 | Note |
|---|---|---|---|
| Jun 2024 | 198.2 | ₹1,288 | Installed 17 June (partial month) |
| Jul 2024 | 357.1 | ₹2,321 | |
| Aug 2024 | 359.9 | ₹2,339 | |
| Sep 2024 | 368.3 | ₹2,394 | |
| Oct 2024 | 437.5 | ₹2,844 | |
| Nov 2024 | 336.3 | ₹2,186 | |
| Dec 2024 | 287.8 | ₹1,871 | Winter low |
| Jan 2025 | 279.1 | ₹1,814 | Winter low |
| Feb 2025 | 412.6 | ₹2,682 | |
| Mar 2025 | 566.5 | ₹3,682 | Record month |
| Apr 2025 | 511.8 | ₹3,327 | |
| May 2025 | 504.4 | ₹3,279 | |
| Jun 2025 | 400.4 | ₹2,603 | |
| Jul 2025 | 358.0 | ₹2,327 | |
| Aug 2025 | 313.3 | ₹2,036 | Cloudy monsoon |
| Sep 2025 | 366.7 | ₹2,384 | |
| Oct 2025 | 381.4 | ₹2,479 | Clear sky |
| Nov 2025 | 356.9 | ₹2,320 | |
| Dec 2025 | 242.7 | ₹1,578 | Lowest full month (fog) |
| Jan 2026 | 296.9 | ₹1,930 | |
| Feb 2026 | 423.6 | ₹2,753 | |
| Mar 2026 | 472.3 | ₹3,070 | Cloudier than Mar 2025 |
| Apr 2026 | 523.0 | ₹3,400 | April record |
| May 2026 | 529.1 | ₹3,439 | Highest month of 2026 |
| Jun 2026 | 482.2 | ₹3,134 | |
| Jul 2026 | 349.6 | ₹2,272 | Monsoon |
| Aug 2026 | 319.4 | ₹2,076 | Monsoon |
| Sep 2026 | 330.1 | ₹2,146 | 10.0% below Sep 2025 |
| Oct 2026 | 168.4 | ₹1,095 | Partial month (to 12 Oct) |
Totals
| Period | Production (kWh) | Value at ₹6.5 |
|---|---|---|
| Jun–Dec 2024 (partial first month) | 2,345.1 | ₹15,243 |
| 2025 (full year) | 4,693.8 | ₹30,509 |
| Jan–Sep 2026 | 3,726.2 | ₹24,220 |
| Total to end of September 2026 | 10,765.1 | about ₹69,970 |
My full-year 2025 yield works out to about 1,385 kWh per kWp, or roughly 3.8 units per kWp per day. That number lets you scale my results to a system of a different size.
How many units does a 3kW system produce per day?
This is what my 3.39 kWp plant delivers at different times of the year:
| Season | Units per day (my plant) |
|---|---|
| March–May | 15–18 |
| June | 13–16 |
| July–September (monsoon) | 10–12 |
| October–November | 11–14 |
| December–January | 8–10 |
| February | about 15 |
Over the whole of 2025 the average was about 12.9 units per day.
Is My Solar Rooftop System Degrading After 2 Years?
I compare the same calendar months year over year, using complete months only.
| Month | 2025 (kWh) | 2026 (kWh) | Change |
|---|---|---|---|
| Jan | 279.1 | 296.9 | +6.4% |
| Feb | 412.6 | 423.6 | +2.7% |
| Mar | 566.5 | 472.3 | −16.6% |
| Apr | 511.8 | 523.0 | +2.2% |
| May | 504.4 | 529.1 | +4.9% |
| Jun | 400.4 | 482.2 | +20.4% |
| Jul | 358.0 | 349.6 | −2.3% |
| Aug | 313.3 | 319.4 | +1.9% |
| Sep | 366.7 | 330.1 | −10.0% |
Jan–Sep 2026: 3,726.2 kWh against 3,712.8 kWh in 2025, essentially flat at +0.4%.
The first half of 2026 ran about 2% ahead, but July to September came in about 3.7% behind the same months of 2025, with September the weakest. [Add one line on what the September daily logs showed: cloud cover, dust, or a clear sky.] March 2026 was also much cloudier than March 2025.
My honest read: I cannot separate degradation from weather with two years of data. Panel warranties typically assume 0.5–1% degradation per year, which is far smaller than normal month-to-month weather swings. I will repeat this same-month comparison every year, and a multi-year record from one owner is something most solar reviews don’t have.
What affects output besides sunshine
- Dust: In my before-and-after test, dusty panels peaked at about 2.8 kW and cleaning restored about 3.1 kW. My method is in the Solar Panel Cleaning Guide.
- Cloud cover: Overcast days cut output even when it doesn’t rain. My daily inverter logs show choppy output on cloudy days, which looks different from the flatter loss that dust causes.
- Heat: Panels lose efficiency at high temperature, so May and June output levels off instead of rising with the sun.
Also Read: Solar Rooftop Plant Maintenance Guide: Cleaning Tips to Maximize Solar Output
Savings and electricity bills
The inverter app values my generation at ₹6.5 per unit: about ₹30,509 for 2025 and about ₹69,970 since installation. That is generation times a fixed tariff, so it is not the same as what my bill actually dropped by.
My electricity bills fell by roughly 40% in summer, 30% in the monsoon (partly offset by more AC use in humid weather) and about 90% in winter, when only the fixed charges remain.
One caution about my inverter app: it shows zero export and sets consumption equal to production, so it cannot tell me how much I self-consume. Actual import and export figures are on my DISCOM net-meter bills, and those are the numbers I trust.
What Is the Real Payback Period of a 3kW Solar Plant?
On my 2025 generation (4,693.8 kWh), here is how payback changes with the value of each unit and with the UP state subsidy:
| Value per unit | Annual value | Payback with UP subsidy (₹95,400) | Payback without UP subsidy (₹1,25,400) |
|---|---|---|---|
| ₹5.0 | ₹23,469 | 4.1 years | 5.3 years |
| ₹6.5 | ₹30,509 | 3.1 years | 4.1 years |
| ₹8.0 | ₹37,550 | 2.5 years | 3.3 years |
This ignores panel degradation, any loan interest and future tariff changes. The rate that matters is the slab you actually offset on your bill, which is usually the top slab you reach, so check your own bills. My payback is on the short side because of the ₹30,000 state subsidy and my slab; in a state without a top-up, or at a lower tariff, expect longer.
Maintenance and support
- Cleaning: Every 15 days. I clean the panels myself, so there is no cleaning cost.
- Annual maintenance cost: ₹0 so far. I have no annual maintenance contract.
- Downtime: None in 27+ months.
- Warranty: Panels 10 years comprehensive, followed by a performance (degradation) warranty, inverter 8 years, installation 5 years.
- Installer support: 5/5 so far (my own rating).
What Are the Disadvantages of Rooftop Solar?
- It stops in a power cut. A standard on-grid system shuts down when the grid fails, so it lowers your bill but gives no backup.
- Subsidy timing: The portal side took patience. Don’t plan your budget around the subsidy arriving quickly.
- Inverter risk: The inverter is the part most likely to need replacing, and my warranty on it is 8 years against 10 years of comprehensive cover on the panels.
- Payback depends on you: Your tariff slab and state subsidy decide the result, not my numbers.
- Output varies by month: December can give less than half of what May does.
Also Read: 11 Facts About Solar Rooftop Plants Every Indian Homeowner Must Know (Real Experience Based)
Frequently asked questions
How many units does a 3kW solar system produce per day?
My 3.39 kWp plant produces about 15–18 units a day in March–May, 10–12 in the monsoon and 8–10 in winter, with a 2025 average of about 12.9. Your numbers will vary with shading, tilt and location.
Is rooftop solar a good investment?
For us, yes: ₹95,400 net cost against about ₹30,500 a year of value, or roughly 3.1 years. Without the UP subsidy, the same plant pays back in about 4.1 years at ₹6.5 per unit. Run the table above with your own tariff before you decide.
Can I run a 1.5 ton AC on a 3kW solar system?
Yes. In an on-grid system, what you can run depends on your sanctioned load, not on the size of the solar plant. If the plant is generating enough power at that moment, the AC runs on solar alone. If it isn’t, for example on a cloudy day or in the evening, solar and the grid share the load automatically: solar supplies what it can and the grid supplies the rest. So a 1.5 ton AC, or any other appliance, will run as long as your total load stays within your sanctioned load.
Does solar work during a power cut?
No. An on-grid system shuts off when the grid goes down to protect line workers. You need a hybrid inverter with a battery for backup.
How much roof space does a 3kW system need?
Mine uses about 300 sq ft including mounting and walking clearance. The six 565W panels cover only about half of that, because high-wattage panels need fewer modules than older ones.
How often should I clean the panels?
I clean every 15 days. In my test, dust cost about 0.3 kW of peak output (2.8 kW dirty against 3.1 kW clean).
Do solar panels lose output over time?
I can’t see any yet. Jan–Sep 2026 is +0.4% against 2025, well within normal weather variation. I will keep updating this comparison each year.
Is the Uttar Pradesh state subsidy available?
It was for me: ₹30,000 on top of the ₹78,000 central subsidy. UPNEDA’s scheme pays ₹15,000 per kW up to ₹30,000 per residential consumer. Policies change, so confirm on UPNEDA’s site before you apply.
Final Thoughts On My Solar Rooftop Plant Review
I would install it again. Over 28 months the plant has generated about 10,765 kWh with no downtime, our winter bills drop by about 90%, and the payback looks like three to four years for us. It is not magic: it does nothing in a power cut, output swings between seasons, and your own payback depends on your tariff slab and state subsidy. Do your own numbers first, get itemised quotes, and check the subsidy rules for your state.
About this data
- Source: My inverter app’s monthly history, exported as a file on 12 October 2026. The 2026 months match the file exactly.
- Value column: Units × ₹6.5, the tariff configured in the app. It is not my bill saving.
- No sponsorship: No brand, installer or reviewer paid for or reviewed this article. The review is based only on my own plant.
- Updates: I update this page as new months are completed.
- Carbon offset: At roughly 0.7 kg of CO₂ per kWh, 10,765 kWh is about 7.5 tonnes of CO₂.
Related reading: How On-Grid Solar Works · 11 Solar Rooftop Facts Every User Must Know

Ayush Singhal is the founder and chief editor of TechMitra.in — a tech hub dedicated to simplifying gadgets, AI tools, and smart innovations for everyday users. With over 15 years of business experience, a Bachelor of Computer Applications (BCA) degree, and 5 years of hands-on experience running an electronics retail shop, Ayush brings real-world gadget knowledge and a genuine passion for emerging technology.
At TechMitra, he covers everything from AI breakthroughs and gadget reviews to app guides, mobile tips, and digital how-tos. His goal is simple — to make tech easy, useful, and enjoyable for everyone. When he’s not testing the latest devices or exploring AI trends, Ayush spends his time crafting tutorials that help readers make smarter digital choices.
📍 Based in Lucknow, India
💡 Focus Areas: Tech News • AI Tools • Gadgets • Digital How-Tos
📧 Contact: Get in touch →
🔗 Full Bio: https://techmitra.in/about-us/
It is in reality a great and useful piece of info.
I am glad that you simply shared this useful info with us.
Please keep us up to date like this. Thank you for sharing.