
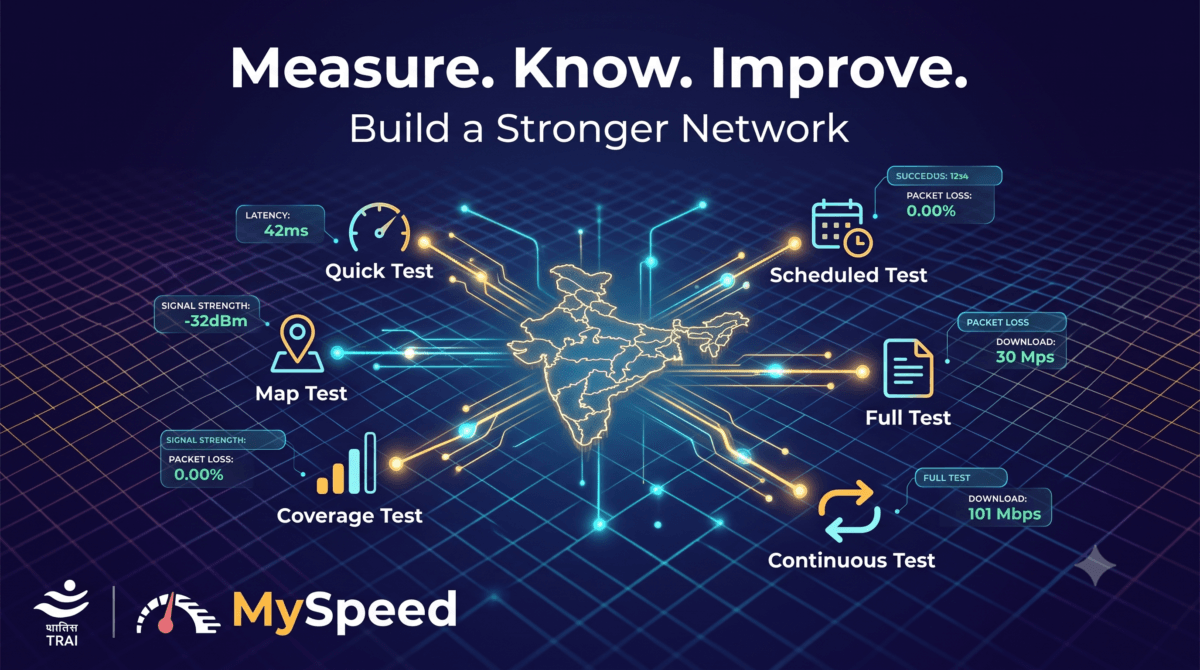
The featured image above is a creative representation designed for illustrative purposes to highlight the app’s features and is not an official graphic issued by TRAI Myspeed.
Your phone shows five bars of 5G. Yet the video won’t load, the page keeps spinning, and the call keeps freezing mid-sentence. If that sounds familiar, you’re not imagining it — and TRAI’s revamped MySpeed app is built to prove exactly why.
I installed the new MySpeed app on my Android phone in Daliganj, Lucknow, and ran it across Wi-Fi, Jio 5G, and BSNL 4G within the same hour, at the same spot. The results were not even close to each other — and that gap is the entire point of this app.
Table of Contents
Check all details of newly launched BSNL Satellite phone here
Why TRAI Rebuilt MySpeed After a Decade
TRAI hadn’t touched MySpeed in any meaningful way for close to ten years. In February 2026, the regulator rolled out a complete revamp of both MySpeed and its DND app, moving away from a simple speed-check tool toward what TRAI itself calls a shift from passive regulation to crowdsourced accountability — treating India’s billion-plus internet users as a distributed network of quality sensors.
This hasn’t been a one-time launch, either. TRAI has kept pushing incremental updates to the app in the months since — the Play Store listing shows a fresh update as recently as June 2026, adding refinements like displaying the name of the connected test server alongside the usual bug fixes and performance improvements. That’s worth knowing if you’re seeing this app back in the news cycle again: it isn’t a brand-new launch, it’s the same February overhaul still being actively refined.
That framing matters. With over 1.31 billion subscribers and more than a billion broadband users, TRAI can’t physically monitor network quality street by street. The revamped MySpeed app effectively turns every test you run into a data point that feeds back into regulatory oversight — anonymised, but useful.
What Actually Changed in the New App
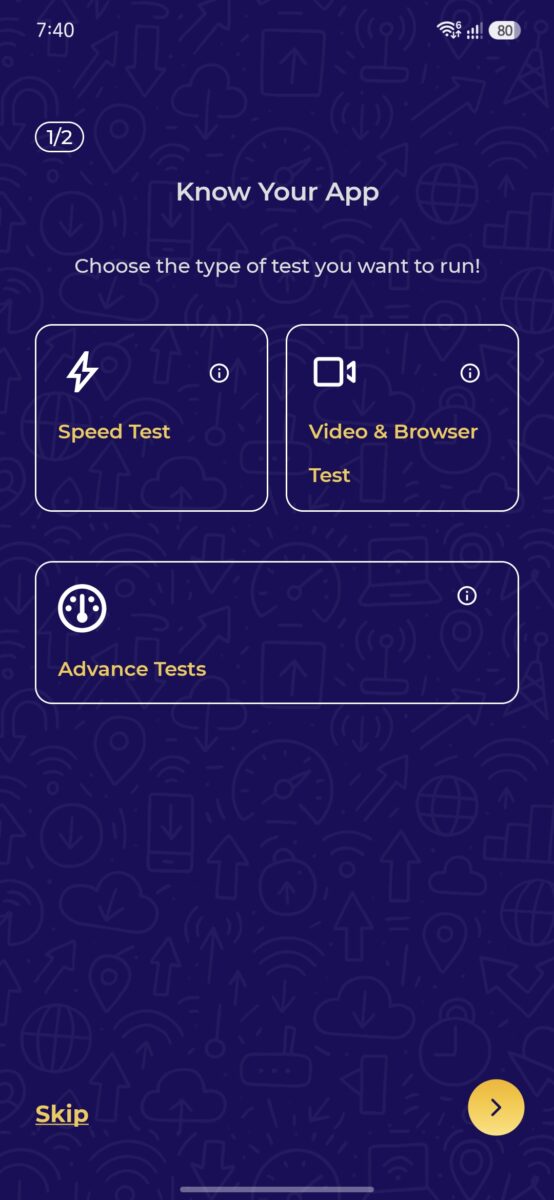
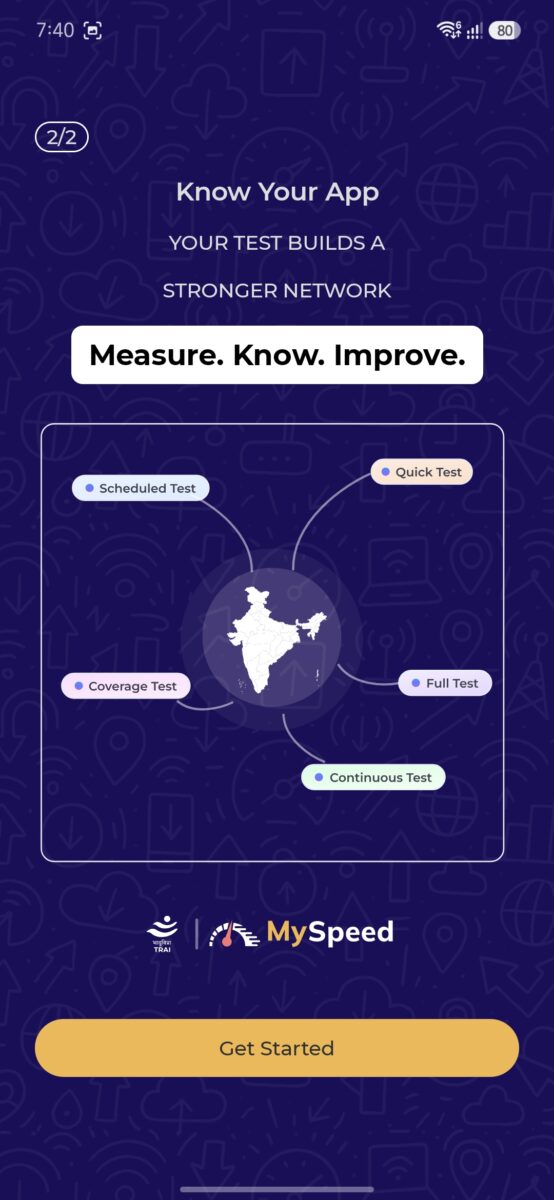
Based on my install and TRAI’s own release notes, the update isn’t cosmetic. Real additions include:
- A standardised, regulator-aligned testing methodology, replacing the old ad-hoc speed check
- Video & Browser Tests that simulate real streaming and web-page-load delay, not just raw throughput
- Continuous and Scheduled Test modes, letting you track network quality while walking, driving, or automatically over a set period
- A dedicated History tab and a Map tab showing aggregated, location-based performance
- Multilingual support, including Hindi and regional languages via Bhashini
- 5G-specific testing, plus support for fixed-line broadband and Wi-Fi
None of this is TRAI guessing at what users want. The regulator has been explicit that full network bars are a poor proxy for real performance, since actual speed depends on location, network congestion, device capability, and time of day — variables a signal icon simply can’t capture.
No App? No Problem: Testing Directly via Web Browser
If you don’t want to install another app on your phone, or if you want to test your home fiber/broadband connection directly from a laptop or desktop, TRAI has you covered. They have launched a full-fledged web version at myspeed.trai.gov.in.
The web interface is clean and mirrors the app’s core functionalities perfectly:
- Instant Testing: You get the same dedicated options for a standard Speed Test or the real-world Video & Browser Test right from your browser.
- Zero-Install Accountability: Just like the mobile application, running the test here routes your data straight through TRAI’s sovereign Indian servers, logging independent performance metrics without requiring a single megabyte of app storage.
My Test Results: Same Location, Wildly Different Reality
Here’s where the app earns its keep. I ran three separate Speed Tests from the same spot in Daliganj, Lucknow, switching networks each time.
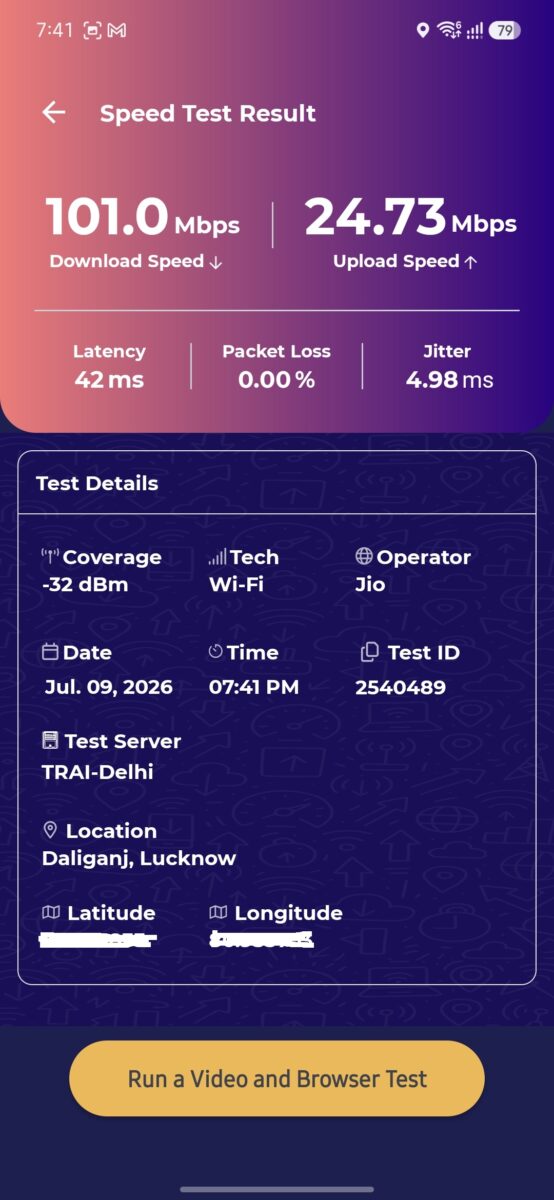
Jio Airfiber Wi-Fi Download speed came in at 101.0 Mbps, with upload at 24.73 Mbps. Latency sat at a clean 42ms, jitter at 4.98ms, and packet loss at a flat 0.00%. Coverage read -32 dBm — about as strong a signal as you’ll ever see. This is what a healthy connection is supposed to look like on paper.
Check My review of JIO Airfiber connection 899 (100 Mbps ) Plan
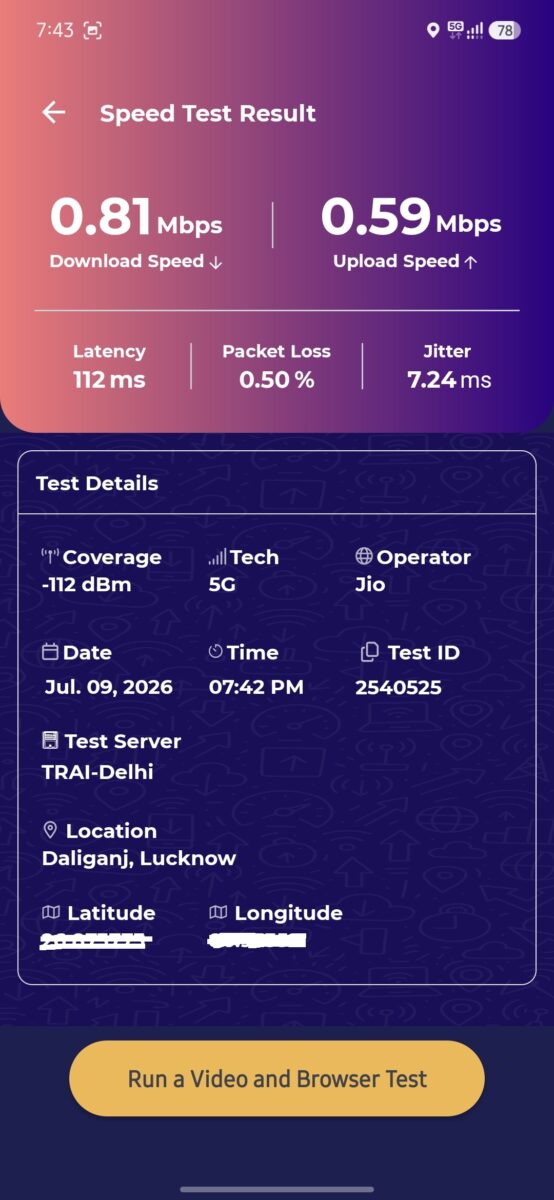
Jio 5G Same location, same hour. Download dropped to 0.81 Mbps and upload to 0.59 Mbps. Latency jumped to 112ms, jitter to 7.24ms, and coverage read -112 dBm — a signal so weak it barely registers, despite the phone showing 5G active with full bars in the status bar. This is precisely the disconnect TRAI is trying to expose: a “5G” icon on screen meant almost nothing about actual throughput at that moment.
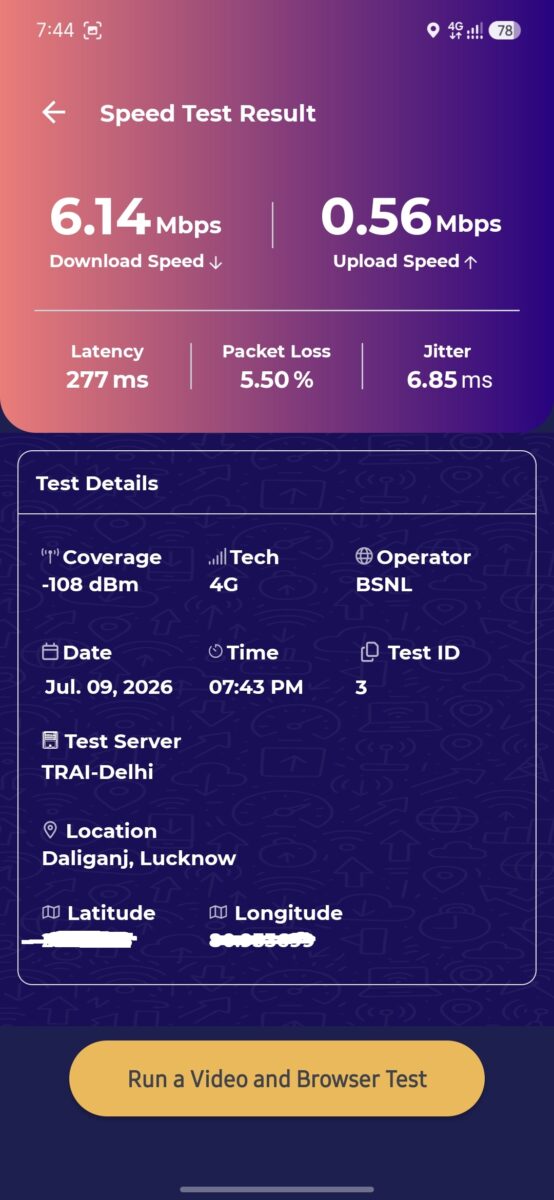
BSNL 4G Download speed measured 6.14 Mbps, upload just 0.56 Mbps. Latency spiked to 277ms, packet loss hit 5.50%, and jitter came in at 6.85ms, with coverage at -108 dBm. At that level of latency and packet loss, video calls and even basic page loads would feel noticeably broken — and they did.
Three networks, one location, one hour. That spread — from a smooth 101 Mbps down to under 1 Mbps — is exactly the kind of real-world variance that a bars-only view of your phone will never show you.
Running the Video & Browser Test
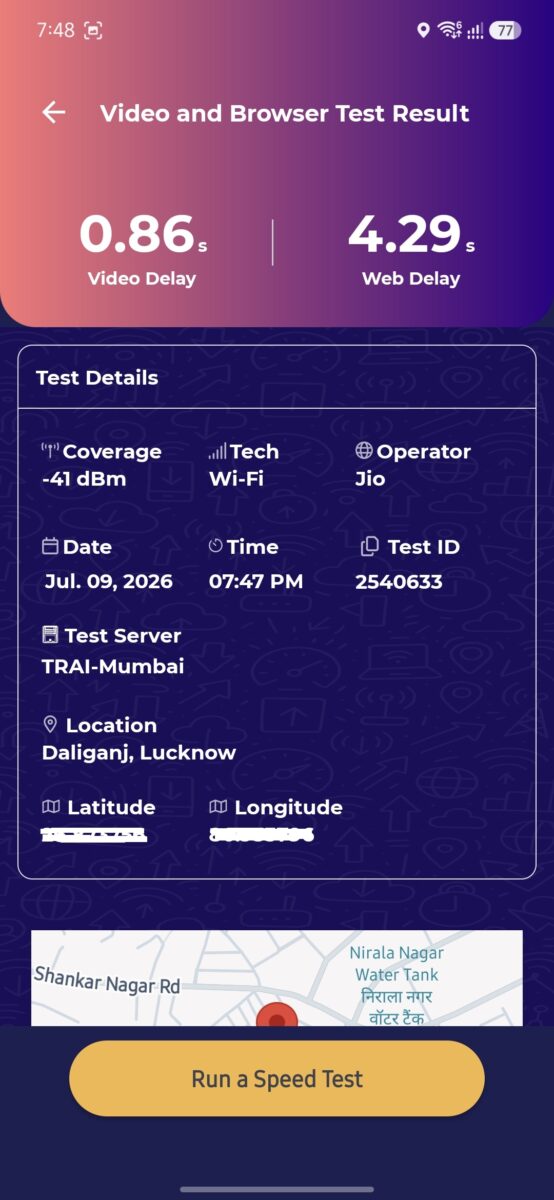
Beyond raw speed, I also ran the newer Video & Browser Test on Jio Wi-Fi, which measures how the network actually handles streaming and page loads rather than just data throughput.
Video delay came in at 0.86 seconds, while web delay measured 4.29 seconds — a meaningfully longer wait than the video test, despite both running on the same 101 Mbps Wi-Fi connection that looked excellent on the speed test alone. This is the value of testing beyond a single Mbps number: two different real-world tasks on the identical connection produced two very different delay experiences.
How the Tests Compare to Third-Party Tools
For context, I cross-checked the same Wi-Fi connection using a well-known third-party speedtest app around the same time. It reported 102 Mbps download and 65.7 Mbps upload — broadly matching MySpeed’s download figure, though showing a considerably higher upload number, along with ping readings ranging from 37ms at idle up to 233–252ms under load. A separate video capability check on the same connection confirmed support for 2160p (4K) streaming with a 699ms load time and zero buffering.
The takeaway isn’t that one app is “more accurate” than the other — different tools use different servers and protocols, so some variance is normal. The value of MySpeed specifically is that its data feeds directly into TRAI’s regulatory picture of Indian network quality, not just your own curiosity.
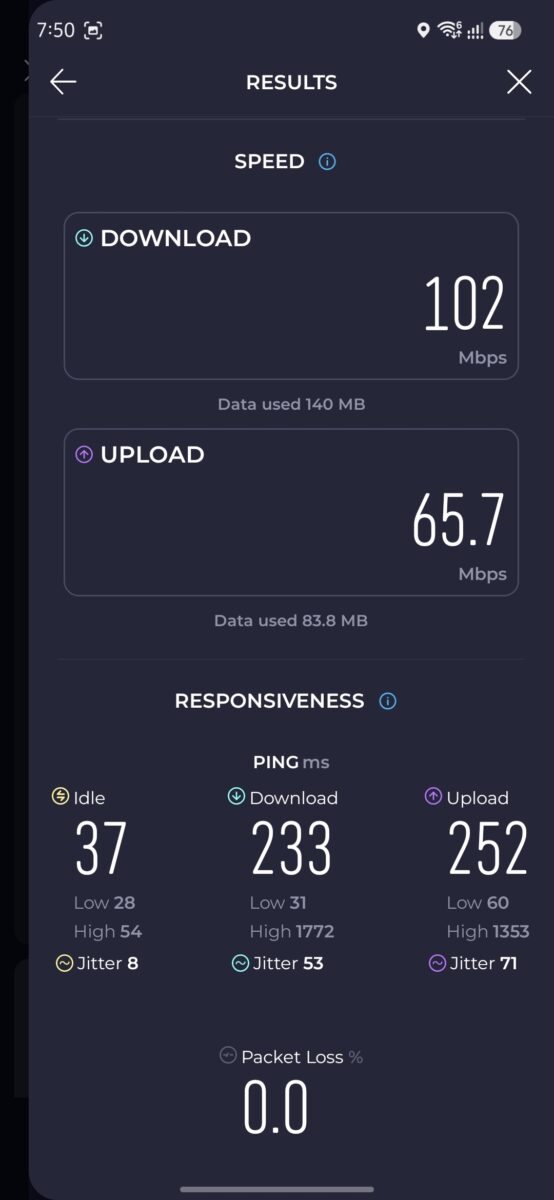
Worth being precise about why the numbers differed, though. Speedtest connected me to a nearby Jio server in Lucknow, which shows the best-case ceiling of what my connection can hit over a short, local hop. MySpeed, by contrast, routed through TRAI’s fixed servers in Delhi and Mumbai. That’s not a shortcoming — it’s deliberate. A regulator can’t compare network quality across India if every user is tested against a different, nearest server; a fixed reference point is what makes results from Lucknow, Chennai, or Guwahati genuinely comparable.
It’s also why my MySpeed upload figure and latency looked different from Speedtest’s: a round trip to Delhi simply covers more distance than a round trip to a server within the same city. In practice, this makes MySpeed a closer proxy for how your connection performs against services actually hosted outside your city — a bank’s servers, a .gov.in portal, or any app not running on a local CDN node — while Speedtest tells you what your ISP is capable of on its best local link.
This explains something I’d noticed for a while but never had a clean reason for. Speedtest consistently shows me a strong 65.7 Mbps upload, yet uploading images to my own WordPress site often feels noticeably slower than that number would suggest. The reason is server distance: my WordPress hosting isn’t sitting on a Jio node down the road in Lucknow, it’s on a hosting data center that could be hundreds or thousands of kilometres away, much like MySpeed’s Delhi and Mumbai servers.
So Speedtest’s 65.7 Mbps was never a lie — it’s just measuring a best-case, short-distance number that real uploads to a distant server rarely get to use. In this sense, the speed MySpeed shows is the more honest, real-world figure, because it’s testing the same kind of long-distance round trip that everyday tasks like a WordPress upload, a bank transaction, or a government portal actually involve.
That said, in my own usage, MySpeed has an edge over Speedtest for anyone testing from India. It logs your exact location — down to the locality, latitude, and longitude — alongside every result, whereas Speedtest simply reports a number without that geographic context. MySpeed also routes through TRAI’s own servers based in India (my tests connected to TRAI-Delhi and TRAI-Mumbai), rather than a third-party global server that might sit further away and add its own latency to the result.
For a genuinely local read on how your operator is performing in your city, that combination of correct location tagging and an in-India server makes MySpeed the more relevant tool.
What TRAI Myspeed Does — and Doesn’t — Collect
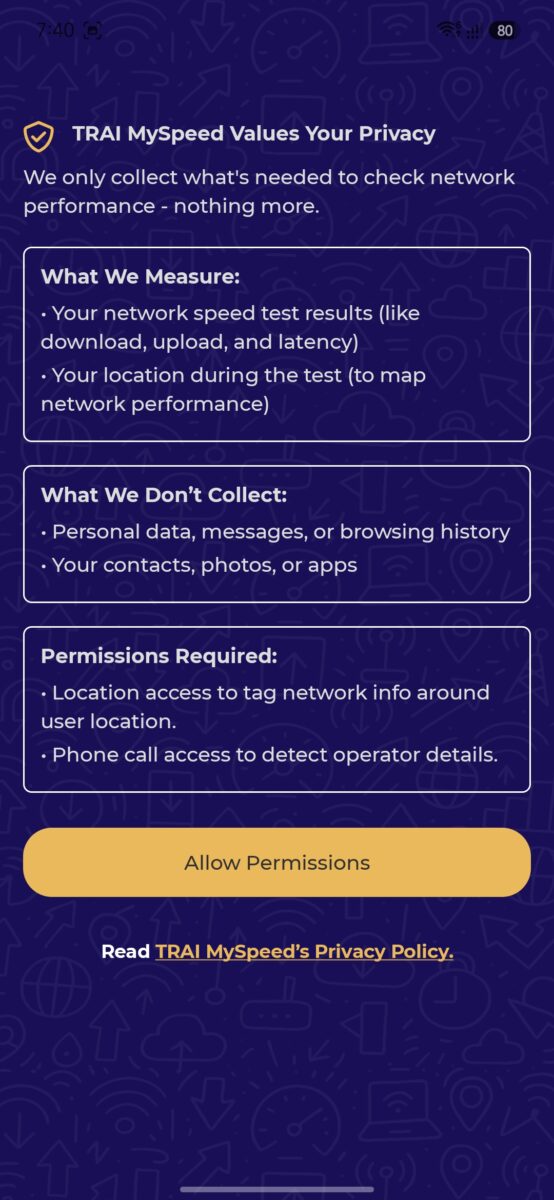
A fair question before installing anything from a government body: what data actually leaves your phone? TRAI has been specific about this. The app captures your speed test results (download, upload, latency, jitter, packet loss), your location during the test to map network performance geographically, and technical context like network type, operator, and technology (Wi-Fi, 4G, 5G).
It does not collect personal data, messages, browsing history, contacts, photos, or installed apps. Two permissions are required to make the tests work: location access, to tag the network data to a geographic point, and phone call access, which the app uses to detect operator details rather than to monitor calls. All data shared with TRAI is anonymised — sending a test result isn’t the same as filing a complaint, and if your service is genuinely underperforming, you’d still need to raise that directly with your operator.
Also Read : Google Just Changed How Android Backups Count Against Your Storage
Inside the Advanced Tests: Continuous and Scheduled Monitoring
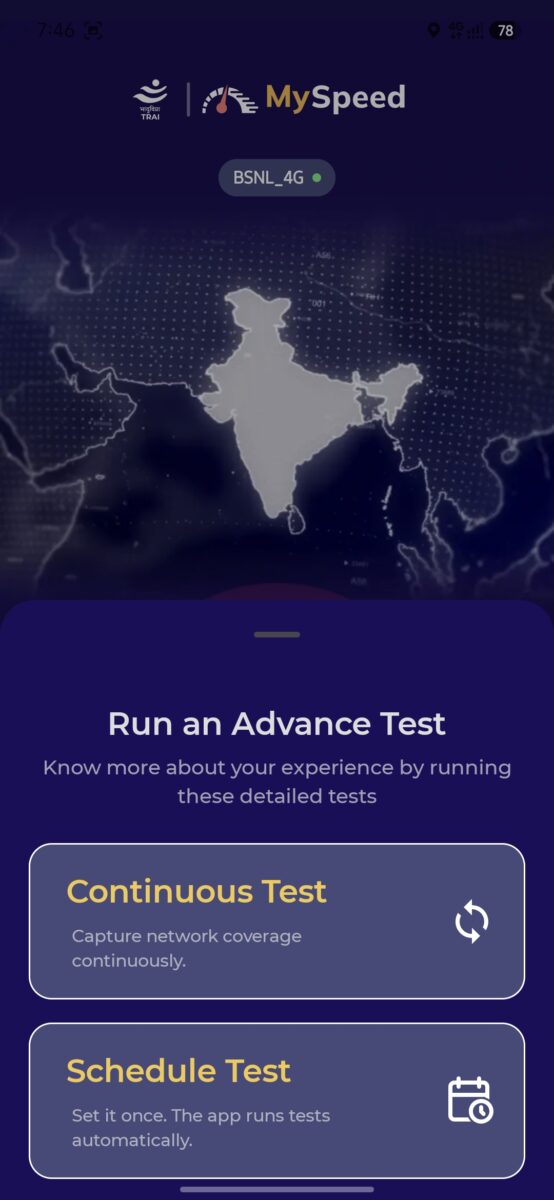
Beyond the standard Speed Test and Video & Browser Test, the app’s Advanced Tests panel offers two modes built for tracking network quality over time rather than a single snapshot.
Continuous Test captures network coverage continuously, running in the background as you move — useful if you want to see how your signal and speed hold up while walking through your house, commuting, or moving between floors of an office.
Schedule Test lets you set it once and let the app run tests automatically at set intervals, without you having to open the app and tap Start Test each time. This is the mode to use if you want a genuine before-and-after picture — say, comparing your operator’s performance in the morning versus late evening over several days — without manually repeating the test yourself.
Both modes feed the same History and Map views as a regular test, so the data still builds into a fuller picture of coverage at your location rather than a one-off number.
How to Run Your Own Test
- Download TRAI MySpeed from the Google Play Store or Apple App Store — note that if you have the old version installed, you’ll get a prompt to switch to the new one.
- Grant the location and phone permissions when asked; both are needed for the test to record properly.
- Choose your test type: Speed Test for a quick download/upload/latency snapshot, Video & Browser Test for real-world streaming and page-load delay, or Advanced Tests for continuous or scheduled monitoring.
- Tap Start Test and wait a few seconds for the full report, which includes your operator, network technology, coverage in dBm, exact location, and a timestamped Test ID you can refer back to later.
- Check the History tab afterward to compare results across different times of day or locations — this is where the real pattern-spotting happens, as my own Wi-Fi-versus-5G-versus-4G comparison showed.
The Bottom Line
Running these tests back-to-back in the same spot made the app’s purpose obvious in a way no press release could. A phone showing full 5G bars delivered under 1 Mbps, while a plain Wi-Fi connection quietly delivered over 100 Mbps with near-zero jitter. If your internet has been frustrating you despite “good” signal, don’t take the status bar’s word for it — run the test yourself and see what’s actually happening on your connection.

Ayush Singhal is the founder and chief editor of TechMitra.in — a tech hub dedicated to simplifying gadgets, AI tools, and smart innovations for everyday users. With over 15 years of business experience, a Bachelor of Computer Applications (BCA) degree, and 5 years of hands-on experience running an electronics retail shop, Ayush brings real-world gadget knowledge and a genuine passion for emerging technology.
At TechMitra, he covers everything from AI breakthroughs and gadget reviews to app guides, mobile tips, and digital how-tos. His goal is simple — to make tech easy, useful, and enjoyable for everyone. When he’s not testing the latest devices or exploring AI trends, Ayush spends his time crafting tutorials that help readers make smarter digital choices.
📍 Based in Lucknow, India
💡 Focus Areas: Tech News • AI Tools • Gadgets • Digital How-Tos
📧 Contact: Get in touch →
🔗 Full Bio: https://techmitra.in/about-us/